|
Windows QTL Cartographer V2.5
|
|
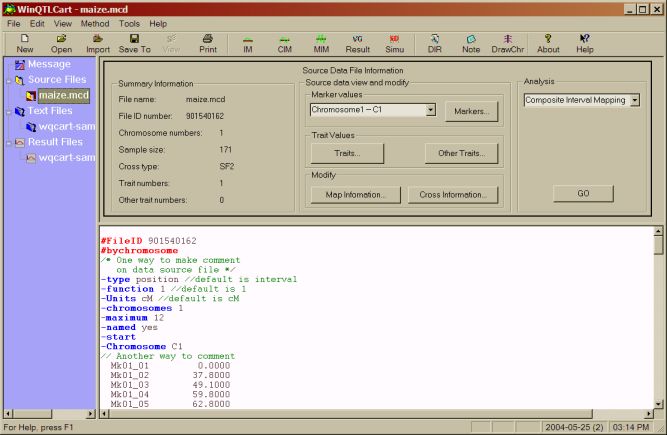 WinQTLCart's Main window allows you to move between
open files, control analysis parameters, and display chromosome
graphics. WinQTLCart's Main window allows you to move between
open files, control analysis parameters, and display chromosome
graphics.
|
|
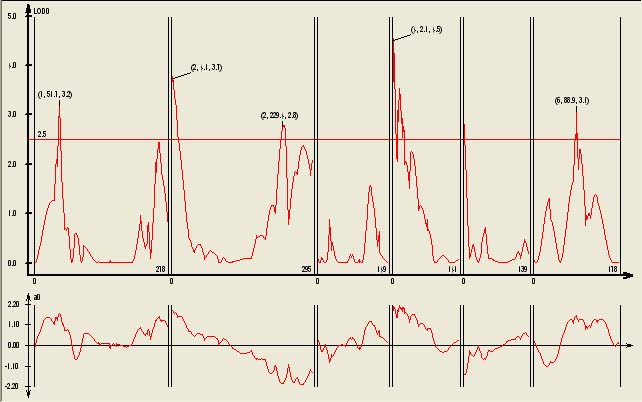 After analyzing the data, WinQTLCart displays the
data as a graph. From here, you can alter the graph display in several
ways, such as adding legends and grid lines. After analyzing the data, WinQTLCart displays the
data as a graph. From here, you can alter the graph display in several
ways, such as adding legends and grid lines.
|
|
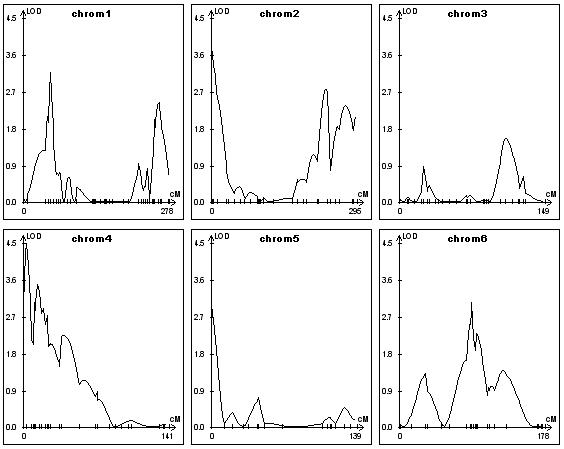 From the graph display, select Tools > Display One
Page Format to display LOD profiles chromosome by chromosome for
publication purposes. From the graph display, select Tools > Display One
Page Format to display LOD profiles chromosome by chromosome for
publication purposes.
|
|
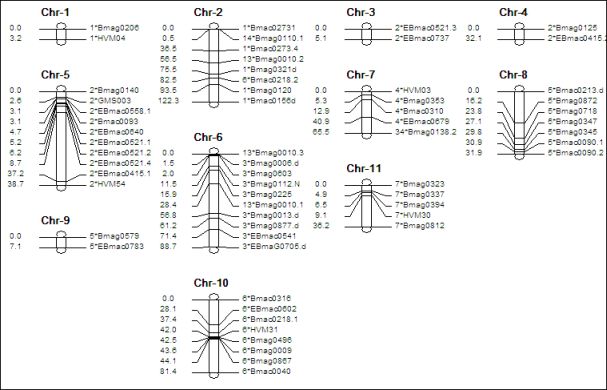 From the Main window, select Draw Chromosomes to
display each chromosome, including its marker labels and intervals. From the Main window, select Draw Chromosomes to
display each chromosome, including its marker labels and intervals.
|
|
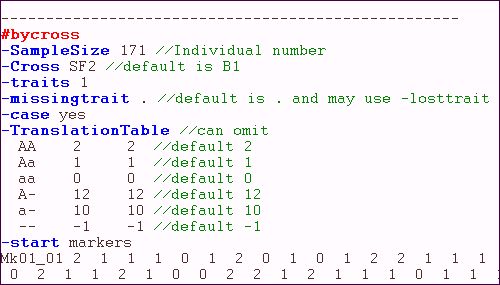 In the Main window, WinQTLCart colorcodes sections
of the source data file. Blue for tokens, green for comments, and so
on. In the Main window, WinQTLCart colorcodes sections
of the source data file. Blue for tokens, green for comments, and so
on.
|
|
|
|
|