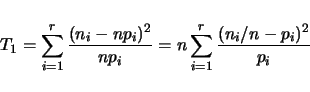
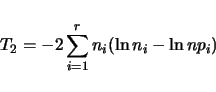
Qstats also tests for adherence to Mendelian segregation at all marker loci. For a
given locus, suppose there are ![]() genotypic classes. Let
genotypic classes. Let ![]() be the expected frequency,
and
be the expected frequency,
and ![]() the observed count for the
the observed count for the ![]() th class. For a sample of size
th class. For a sample of size ![]() ,
the expected counts will be
,
the expected counts will be ![]() and the observed frequencies will be
and the observed frequencies will be ![]() .
We can construct a test statistics based on a contigency table
.
We can construct a test statistics based on a contigency table