next up previous contents index
Next: Output Up: LRmapqtl Previous: LRmapqtl   Contents   Index

Simple Linear Regression

For each marker in turn, LRmapqtl fits the phenotypic data to the linear model
\begin{displaymath}
y_i = b_0 + b_1 x_i + e
\end{displaymath} (3.2)

where $y_i$ is the phenotype of the $i$th individual and $x_i$ is an indicator variable for the marker genotype. Generally,

\begin{displaymath}
x_i = \left\{ \begin{array}{lll}
2 & {\rm if } & A_1 A_1 \...
... } & A_1 A_2 \\
0 & {\rm if } & A_2 A_2
\end{array} \right.
\end{displaymath}

but for $B_1$ crosses

\begin{displaymath}
x_i = \left\{ \begin{array}{lll}
1 & {\rm if } & A_1 A_1 \\
0 & {\rm if } & A_1 A_2
\end{array} \right.
\end{displaymath}

If the marker is missing or dominant, then an expected value for the marker is calculated from the flanking markers [Fisch, Ragot, and GayFisch et al.1996,Jiang and ZengJiang and Zeng1997]. The regression parameters $b_0$ and $b_1$ can be estimated, and $e$ is assumed to have a normal distribution.

LRmapqtl can also take into account categorical traits, that is other variables such as sex or brood, in its analysis. If your data set contains such information, then there should be a list of the names of these other variables near the beginning of the ``Rcross.out'' formatted file. These names might look as follows:

    -Names of the other traits...
      1 Sex
      2 Line
If you would like to include ``Sex'' and ``Sex by Marker interaction'' terms in your analysis, then you need to indicate as much to LRmapqtl. If you prefix the name of one of these variables with a plus sign $(+)$, then it will be incorporated into the linear model.
    -Names of the other traits...
      1 +Sex
      2 Line
In LRmapqtl, this would consider both Sex and Sex by Marker interaction terms. In Zmapqtl and SRmapqtl, the Sex by Marker term wouldn't be incorporated, but the Sex factor would. All other variables that have no + sign at the beginning of their names 
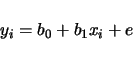
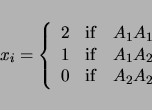
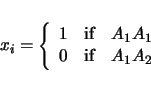
will be ignored in the analysis. For the above example, a pair of models will be considered:
$\displaystyle y_i$ $\textstyle =$ $\displaystyle b_0 + b_1 x_i + b_2 Sex + b_3 Sex \times x_i + e$ (3.3)
$\displaystyle y_i$ $\textstyle =$ $\displaystyle b_0 + b_2 Sex + e$ (3.4)

The output will give probabilities that the marker is significant.

Table 3.2 shows the command line options specific to LRmapqtl. As with Qstats, there are few parameters to change. The -t option allows you to specify a trait to analyze. It is trait 1 by default. If you only have one trait, you can ignore this option. If your data set has more than one trait, you can analyze a specific trait by using -t with an integer from 1 to the number of traits. If you want LRmapqtl to analyze all traits, use a value greater than the number of traits.


Table 3.2: Command Line Options for LRmapqtl
Option Default Explanation
-i qtlcart.cro Data Input File
-o qtlcart.lr Output File
-m qtlcart.map Genetic Linkage Map File
-r 0 Number of permutations
-t 1 Trait to analyze


next up previous contents index
Next: Output Up: LRmapqtl Previous: LRmapqtl   Contents   Index
Christopher Basten 2002-03-27