As an exercise in learning to use the programs, you can simulate a genetic linkage map. The main parameters that you will need to specify are the haploid number of chromosomes, average number of markers per chromosome, and average intermarker distance between consecutive markers. You can also simulate linkage maps in which the telomeres don't have marker information.
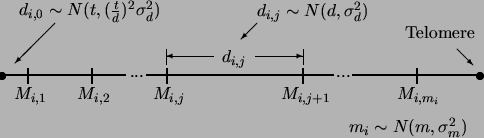
Figure 2.3 shows how Rmap simulates a genetic linkage map where ![]() is
marker
is
marker ![]() on chromosome
on chromosome ![]() . We denote the number of chromosomes
by
. We denote the number of chromosomes
by ![]() , the average number of markers per chromosome by
, the average number of markers per chromosome by ![]() and the average
intermarker distance by
and the average
intermarker distance by ![]() in centimorgans. Furthermore, the average
amount of ``tail'' DNA (DNA outside the most telomeric markers) will be specified
by
in centimorgans. Furthermore, the average
amount of ``tail'' DNA (DNA outside the most telomeric markers) will be specified
by ![]() , again in centimorgans. The standard deviations of
, again in centimorgans. The standard deviations of ![]() and
and ![]() will by
will by ![]() and
and ![]() , respectively. All of these variables can
be specified by command line options, the resource file or by the interactive
menu. The standard deviation of
, respectively. All of these variables can
be specified by command line options, the resource file or by the interactive
menu. The standard deviation of ![]() will be
will be
![]() . For the
. For the ![]() th chromosome, Rmap decides how many markers are on that
chromosome
th chromosome, Rmap decides how many markers are on that
chromosome ![]() by picking a random number from a normal distribution with mean
by picking a random number from a normal distribution with mean
![]() and standard deviation
and standard deviation ![]() . Once this is done, the amount of DNA between
consecutive markers
. Once this is done, the amount of DNA between
consecutive markers ![]() is simulated as a normal random variable with mean
is simulated as a normal random variable with mean ![]() and standard deviation
and standard deviation ![]() . Finally, the amount of telomeric or tail DNA
. Finally, the amount of telomeric or tail DNA
![]() is
simulated as a normal random variable with mean
is
simulated as a normal random variable with mean ![]() and standard deviation
and standard deviation
![]() . Setting a standard deviation equal to zero means that the quantity in
question is not a random variable, but set equal to its mean value.
. Setting a standard deviation equal to zero means that the quantity in
question is not a random variable, but set equal to its mean value.
The parameters
![]() and
and ![]() can be set using
the command line options of Table 2.1 or in the interactive menu. Note
that if an input file is specified, all these parameters are ignored and Rmap
attempts to translate the input file.
can be set using
the command line options of Table 2.1 or in the interactive menu. Note
that if an input file is specified, all these parameters are ignored and Rmap
attempts to translate the input file.
An alternate method of simulating the genetic linkage map can be invoked by changing
the simulation mode parameter from 0 to 1 using the -M command line option.
Figure 2.4 presents the method graphically.
The length of chromosome ![]() (
(![]() ) will be normally distributed with
mean
) will be normally distributed with
mean ![]() and standard deviation
and standard deviation ![]() .
The number of markers on chromosome
.
The number of markers on chromosome ![]() (
(![]() ) will still be normally distributed with
mean
) will still be normally distributed with
mean ![]() and standard deviation
and standard deviation ![]() , but
will be placed on the chromosome following a uniform distribution on the interval
, but
will be placed on the chromosome following a uniform distribution on the interval ![]() . You should set the values
of
. You should set the values
of ![]() and
and ![]() to appropriate levels, as they are for chromosome length rather
than intermarker distance in this mode. For example, if you want roughly the same
results from this mode as that in the original, then set
to appropriate levels, as they are for chromosome length rather
than intermarker distance in this mode. For example, if you want roughly the same
results from this mode as that in the original, then set
![]() in this mode.
in this mode.